
How important is in science to show a concept through images, and how effectively can scientists communicate through this medium?
Since my first year at university, I have always been intrigued by the representation of biological objects that can be found in textbooks and scientific articles. I soon found myself jumping directly to a paper’s figures when trying to get a clearer idea about the authors’ experimental plan or about the final results. I was impressed by the amount of information and knowledge an image can convey. So, I started realising how important images are in science and how much more limited most of the scientific discourses would be without proper visual representations backing them.
Earlier this year I had the chance of doing some in-depth research about this aspect of science. So, I wrote an essay focusing specifically on molecular pathways. Why did I choose this topic? Because visualising a pathway is a tough job that requires a lot of elements in order to be effective and compelling; and most of all because these are not simply images, but representations of scientific theories. Let me try to give you a quick overview of the main aspects I examined, and if you are interested in reading the entire essay, you can find it here.
The crucial point is that diagrams such as biological pathways are not ‘just’ images or replications of reality. On the contrary, they are active reinterpretations and idealisations of an observable object. Let’s take the representation of an animal cell from the children’s Encyclopaedia Britannica. What is showed in this image is not a real cell, nor an accurate representation. It is a ‘visual recap’ of what science can tell us about the main features of animal cells. Colour, shape and size are idealised and altered in order to emphasise the information over the representational accuracy, and to pass from the particularity of an observation to the generality of a scientific claim. Once coupled with names or a complex text, this image becomes a proper store of information that one can recall at a glance. Pretty impressive, isn’t it?
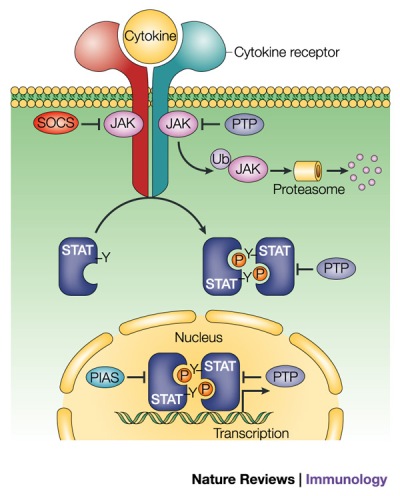
Molecular pathways representation generates from the same approach, while adding an extra level of complexity. Indeed, when talking of pathways, we are not dealing with lasting objects, but with phenomena, events in which the interaction between the molecules has a beginning and an end. Scientists can observe these interactions only by checking if and how a system is altered after a certain event is supposed to have taken place. For example, does blocking receptor X result in an alteration of, say, the amount of protein Y? If so, are these elements somehow correlated?
Thus, pathways are mathematical and logical representations of a phenomenon. In a molecular pathway diagram, we can see the time dimension in the form of consequent events or changes of states in the same structure, which are linked with arrows. Therefore, we see Protein A moving from Site X to Site Y; or protein B changing from State 1 to State 2. We can also distinguish whether a certain molecule triggers or inhibits a reaction – in the latter case, a flipped T is used in place of an arrow. The addition of time through the use of symbols allows to transform a static image into a dynamic narrative; something more similar to a theory or to a discourse rather than to a mere representation. And that brings me to the final aspect I want to mention. That pathways are visual representation of theories.
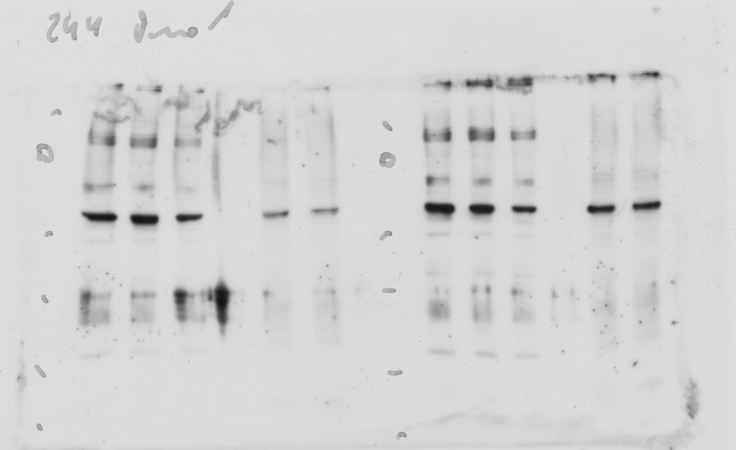
Science is based on observations. However, our eye cannot observe a living cell or a bacterium and, therefore, scientists must use instruments like the microscope that enable them to visualise what would be invisible otherwise. As sociologists pointed out, this means that every act of observation is mediated by the use of an instrument that often enables us to visualise just a ‘trace’ of the object. More importantly, in order to read such an image, one must possess a prior knowledge allowing him or her to actively use these instruments and to interpret the signal that they generate. An example? Just think about western blot. This technique allows the visualisation of a certain protein’s amount in a cell under the form of a photographic trace. Anyone who doesn’t know how this technique works or how to read the results would be completely clueless about what to get from it. Thus, when we observe a biological pathway diagram, we are not observing the representation of an object, but the interpretation that scientists gave of an certain event.
Interested in knowing more? You could read the entire essay or jump at the end of the essay where you can find the texts I used for my research.
Header image: Wnt Signaling Pathways, beta-Catenin-dependent Wnt Signaling (modified). From rndsystems.com

Leave a comment